
Von Alexander Weis und Selina Gschossmann
Indexing 101 is the English language version of our blog post „Passiv investieren – die Basics“, which is a primer in passive investing with index funds and ETFs, commonly referred to as indexing.
This text presupposes moderate capital markets knowledge. That is, you should have a basic understanding of what stocks, bonds and ETFs are, where and how to buy them and you should be somewhat familiar with concepts such as risk and return.
First, we provide you with an overview of the most relevant types of investments. We then examine risk and return of each investment type. Thereafter, we tackle the crucial question of investing („do I want to be an active or passive investor?“) and show why passive investing is superior to active approaches. Finally, we present a simple recipe for a passive portfolio consisting of two ETFs only – investing is not going to get any easier than that.
Let’s get started!
Asset classes – an overview
An asset class is a logical grouping of investment assets that are relatively similar to each another in terms of their return, risk and liquidity profiles, respectively.
The following is an overview of the most important investable asset classes:
- Stocks: equity investments in publicly listed companies
- Bonds: exchange-traded loans to governments or corporations
- Real estate: residential and commercial real-estate investments
- Commodities: natural resources such as oil, wheat or base metals
- Precious metals: subgroup of commodities (such as gold, silver or platinum)
- Collectibles: art, vintage cars, luxury watches, collector wines, etc.
- Cryptocurrencies: Bitcoin, Ethereum, Tether, etc.
These are the asset classes that private investors can invest in at reasonable cost and effort.
Contrary to popular belief, bank deposits are not an asset class themselves but unsecured loans by a depositor (bank customer) to a credit institution (mostly banks).
Financial products such as life insurance, annuities, private equity, hedge funds, structured notes, actively managed investment funds and ETFs are merely repackaged asset classes.
Wrapping an asset class into a financial product may or may not be useful from a rational investor perspective. The packaging may be thin or thick. For example, hedge funds are investments with thick, expensive and complex (nontransparent) wrapping around stocks, bonds or derivatives of these. ETFs represent very light, inexpensive, simple und super-transparent wrapping.
Frequently, wrapping of financial products is so thick and complex that it even introduces additional risks that the underlying asset class itself does not have. An example would be German life insurance („kapitalbildende Lebensversicherungen“). They represent a wrapped stock or bond investment but the insurance wrap introduces significant counterparty risk vis-à-vis the insurance firm as well as visible and invisible costs.
Let’s move on!
Risk and return – which asset class should I choose?
To find out which asset class and in which blend thereof you should invest in, you need to first decide what goal you want to pursue with your investment. Normally, the answer will be something like: „achieving the highest possible return with the lowest possible risk“. Therefore, we take a look at the risk and return of the main asset classes in table 1 (cryptocurrencies are not included in the table due to their short history; collectibles are missing due to lacking consensus what their long-term historical returns are):
Table: 1: Inflation-adjusted long-term returns of major asset classes in USD from 1900 to 2021 (122 years)
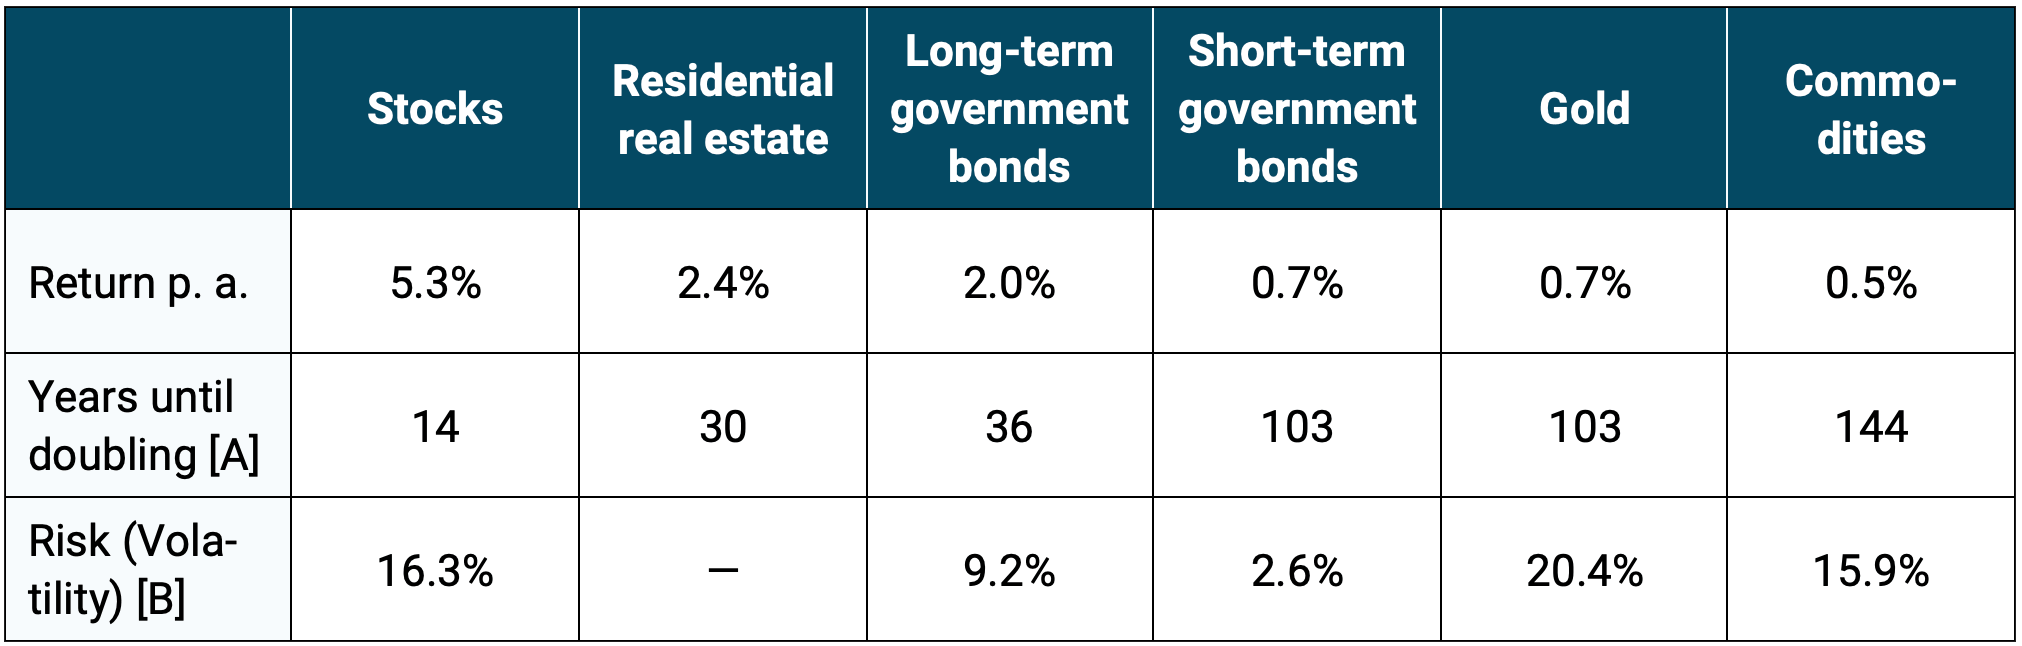
► [A] Years until doubling: Number of years until an initial one-time investment would have doubled at the given average return (excluding costs and taxes). ► [B] Risk: Standard deviation of calendar year returns (volatility) from 1975 to 2021. No volaltility number for real estate due to lack of true and „honest“ data needed for a fair comparison with the other asset classes. ► All returns in US dollars (excl. residential real estate which are a population-weighted average of the local currency returns of nine western countries. ► All returns are total returns adjusted for inflation excluding costs and taxes. ► All returns excluding expenses and taxes (but including maintenance costs for real estate). ► Residential-real-estate returns: Deviating period from 1900 to 2017. ► Data: Dimson, Marsh, Staunton (2022); Morningstar; David S. Jacks (Gold, Commodities).
What can be inferred from the table? The first thing that catches the eye is that the returns are probably (a lot) lower than what you might have assumed. One reason for this is that we are talking real (inflation-adjusted) returns here, that is returns after deducting inflation. Another reason is that the media, the internet and investment books for decades have instilled in us an exaggerated notion of what realistic long-term returns of different asset classes are. The numbers in the table are simply what you could have earned by investing in the capital markets over the last 120 years without any false promises made.
Any rational saver and investor will have to come to terms with this reality for better or for worse at some point – but more on that below.
The second conclusion to be drawn from the table is that equities have the by far highest return of any asset class: twice that of real estate, two-and-a-half times that of long-term government bonds, and six times (!) that of gold.
Third, short-term government bonds are the least risky among all asset classes, again by a rather wide margin.
What do we learn from these observations? If you want to make the most of your money, there is no reasonable alternative to investing some part of your wealth in stocks – ideally in globally diversified stock portfolio. Since most investors cannot (or do not want) to live (and sleep) with the fluctuations of the stock market, stocks should be supplemented with something less volatile; and nothing is suited better for this job than high-quality short-term bonds in your home currency.
So much for the foreplay – let’s get to the fun part!
Active vs. passive investing – the crucial question
Anyone who wants to invest their money in the capital markets will sooner or later be confronted with the question of whether an active or passive investment approach should be preferred. But what is active and passive investing all about? (In order to keep things simple, we will limit ourselves to stocks and leave out bonds in our following explanations.)
Put simply, a passive investor buys the „market“ (the global stock market in our case) on a buy-and-hold basis. By doing so, they receive the market return aka asset-class return (minus the costs of investing) while at the same time being fully exposed to market fluctuations. As we saw above, you can make roughly 5% a year in the stock market, after deducting inflation (but before costs and taxes). „Buying the market“ can be easily accomplished by buying an ETF or two as outlined at the end of this article.
An active investor, on the other hand, wants more than „just“ the market return as they believe that it is possible to systematically beat the market, that is generate a return that is relatively consistent above market return. You can attempt this by either buying the stocks that you think will outperform the market („stock picking“), or by „entering“ the market (the asset class) whenever it is down and „getting out“ of the market just before the next crash („market timing“).
Active investing is always and inevitably some form of stock picking, market timing or a mix of both. It can be done as both a do-it-yourself („DIY“) investor or by outsourcing the task of investment management to an advisor (such as a wealth manager or bank), which pretty much always comes at a relatively high price in the form of a fee (and often a bunch of other „creative“ difficult-to-detect costs on top).
For all of you who have gotten caught up in all our metaphors, we came up with table 2 that illustrates some key differences between active and passive investing in a concise way:
Table 2: The main differences between active and passive investing
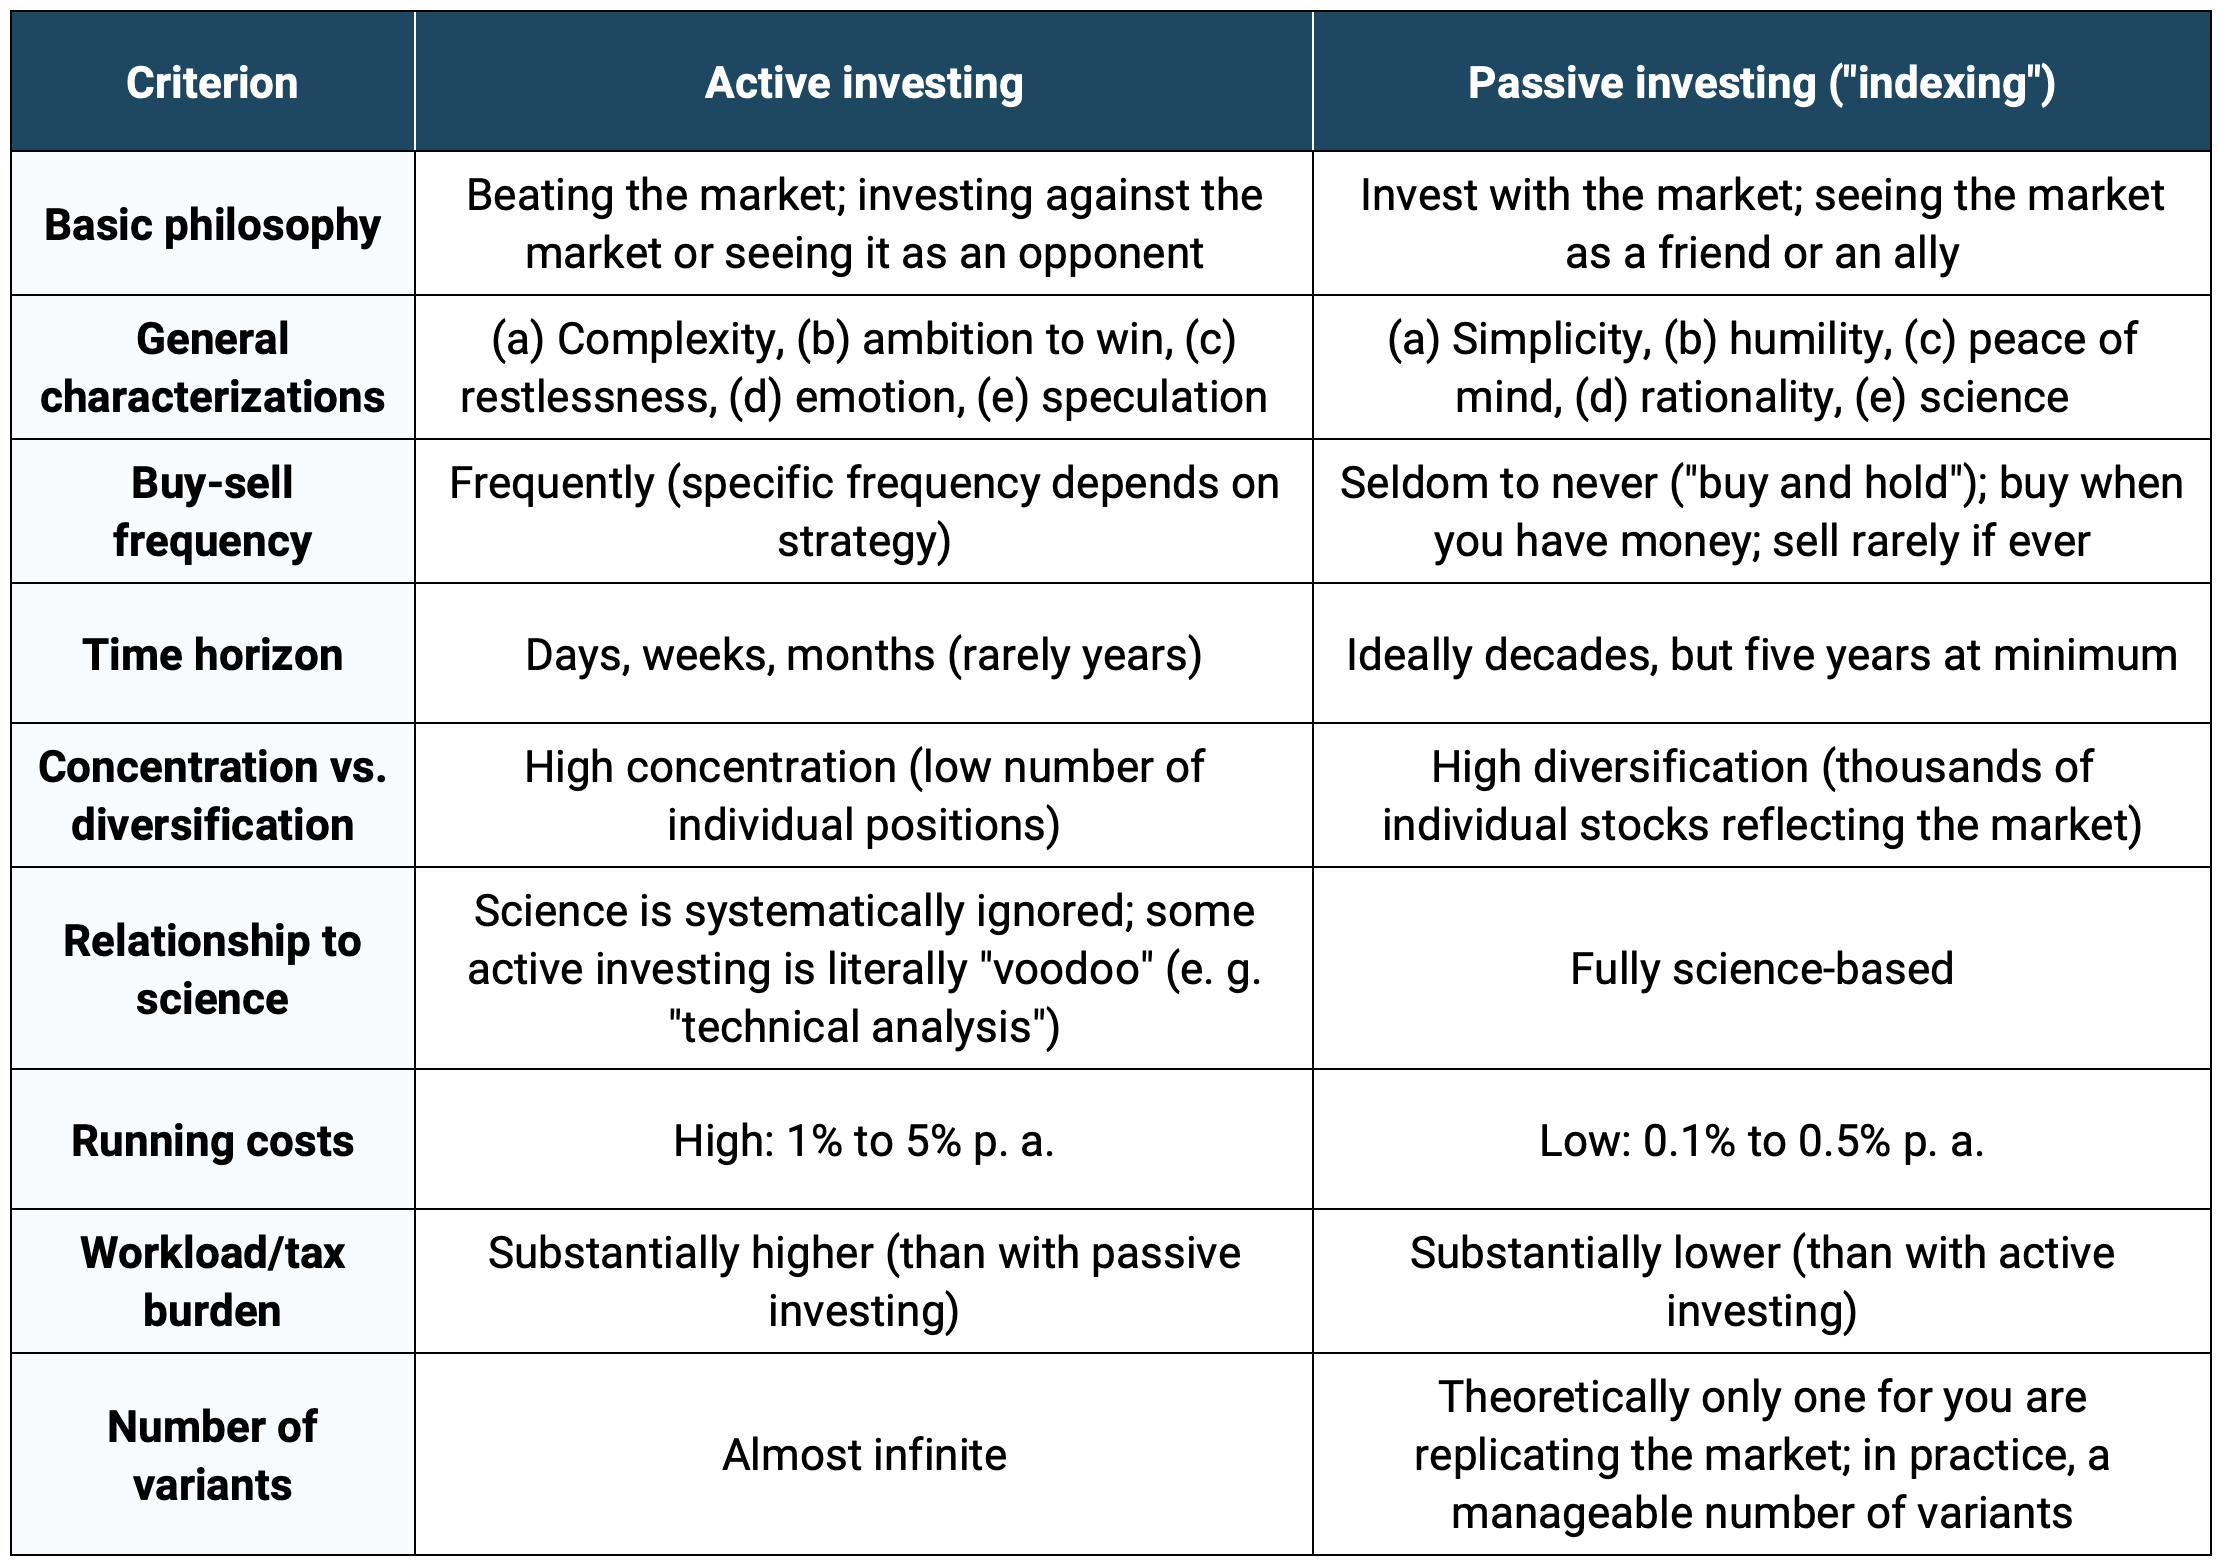
Source: Der Leichte Einstieg in die Welt der ETFs (book in German) by Dr. Gerd Kommer
Why is passive investing the way to go in investing?
In a nutshell: Because it’s more profitable than active investing.
We haven’t pulled this claim out of thin air. There is sound science to back it up: over the past 60 or so years, literally thousands of scientific studies have been published that demonstrate the statistical superiority of passive investing compared to its active siblings.
Since significantly more money can be made with active investing though, the financial-services industry is still mostly offering solutions for active investing – regardless of what science says or not.
Active investing is also more lucrative for the media and internet businesses as stories about stock picking and the like usually achieve more impressions and higher click rates.
In any case, the scientific evidence for passive investing being superior to active investing is literally overwhelming.
But as we don’t want to leave it to mere assertions on our end, we will now set forth both a theoretical and an empirical argument that we borrowed from science; and then let the data speak for themselves.
Theory: the arithmetic of active management
The arithmetic of active investment management (both a phrase and concept coined by William Sharpe, a Nobel prize-winning economist) states that all investors – before costs – must collectively earn the market return because they collectively are the market. This in turn means that 50% of all money invested – again before considering costs – must necessarily generate a return below market return and, conversely, 50% must generate a return above market return. Passive investors buy (and hold) the whole market and thereby earn the market return. All of this is a mathematical necessity that cannot be argued away and holds true entirely independent of the behavior of the market participants, both individually and collectively.
Now we introduce costs into the equation. These are necessarily higher for active investors than for passive investors. It follows that, as a group, passive investors earn higher returns than active investors. Thus as a group, active investors must underperform the market.
Now let’s have a look at the empirical data.
Empiricism: outperformers are about as reliable as a zero in roulette
The practical part of our argument is based on a study conducted by S&P Dow Jones Indices, one of the major global index providers, which has the somewhat cumbersome title Standard & Poor’s Index Versus Active, or „SPIVA“. SPIVA compares the performance of actively managed investment funds to their passive benchmarks, allowing for conclusions about the success rate of active investing over both different time periods and geographical regions. (There are several comparable studies that come to similar conclusions, but we chose SPIVA because it is one of the most thorough of its kind, it has been updated semi-annually for the past 20 or so years, and it is publicly available, completely free of charge.)
Two primary conclusions can be drawn from the SPIVA study:
- Outperformers are a minority: Passive benchmarks beat active funds over a randomly chosen period of 12 months in around 50% to 70% of cases. For periods of more than ten years, passive funds beat their active competitors in around 80% to 100% of cases. The outperformance of passive funds tends to increase with the length of the observation period. The obvious question following from this statistical observation is „why not just invest in the minority of active funds that do beat their passive benchmark? This approach, unfortunately, does not work as we will see in a jiffy.
- Outperformers rarely remain outperformers for long: The composition of active funds that manage to beat their benchmark changes pretty much randomly from measurement period to period. In one of the recent SPIVA studies, only 62% of the top quartile (top 25%) of equity funds in 2017 made it back into the top quartile in 2018 (one year later); in 2019 (two years later) it was only 37%; in 2020 (three years later) roughly 28% and in 2021 (four years later) ridiculously low 1.7%. This means that less than two percent of the original top equity funds of 2017 remained in the top group during all the following four years. In the case of bond funds, this „performance decay“ is routinely even more drastic. Note that that this decay is even worse than what would happen if random chance were to rule this process. It follows, that the popular method of picking funds that have historically performed particularly well is doomed to failure, often yielding worse outcomes than randomly selecting funds.
We’ll leave it at that and conclude our case against active investing, thereby setting the stage for indexing. We now proceed to the practical question of how to implement a simple passive investing portfolio.
How to passive investing?
Contrary to what many people believe, passive investing (or „indexing“, as it is sometimes called) is not new. It has been around for over 50 years. The first index fund was introduced in the US in 1971. In the early 1990s ETFs, a variation of traditional index funds, were first introduced in Canada.
The first thing you have to do in order to set up you passive portfolio is to determine the proportion (the mix) between risky and „risk-free“ assets in your portfolio (e. g. 60/40) and then, to fill each of them up with specific ETFs.
This „static asset allocation“ should then be implemented on a strict buy-and-hold basis. The buy-and-hold principle is as essential to passive investing as is broad diversification and cost minimization via index funds.
This is the Weltportfolio („world portfolio“) concept by Dr. Gerd Kommer that he derived from decades of established scientific research. In its simplest form, a single ETF is sufficient for the risky and the risk-free part of the portfolio, respectively. We have illustrated this in the chart below.
Chart: schematic representation of the Weltportfolio („world portfolio“) by Dr. Gerd Kommer
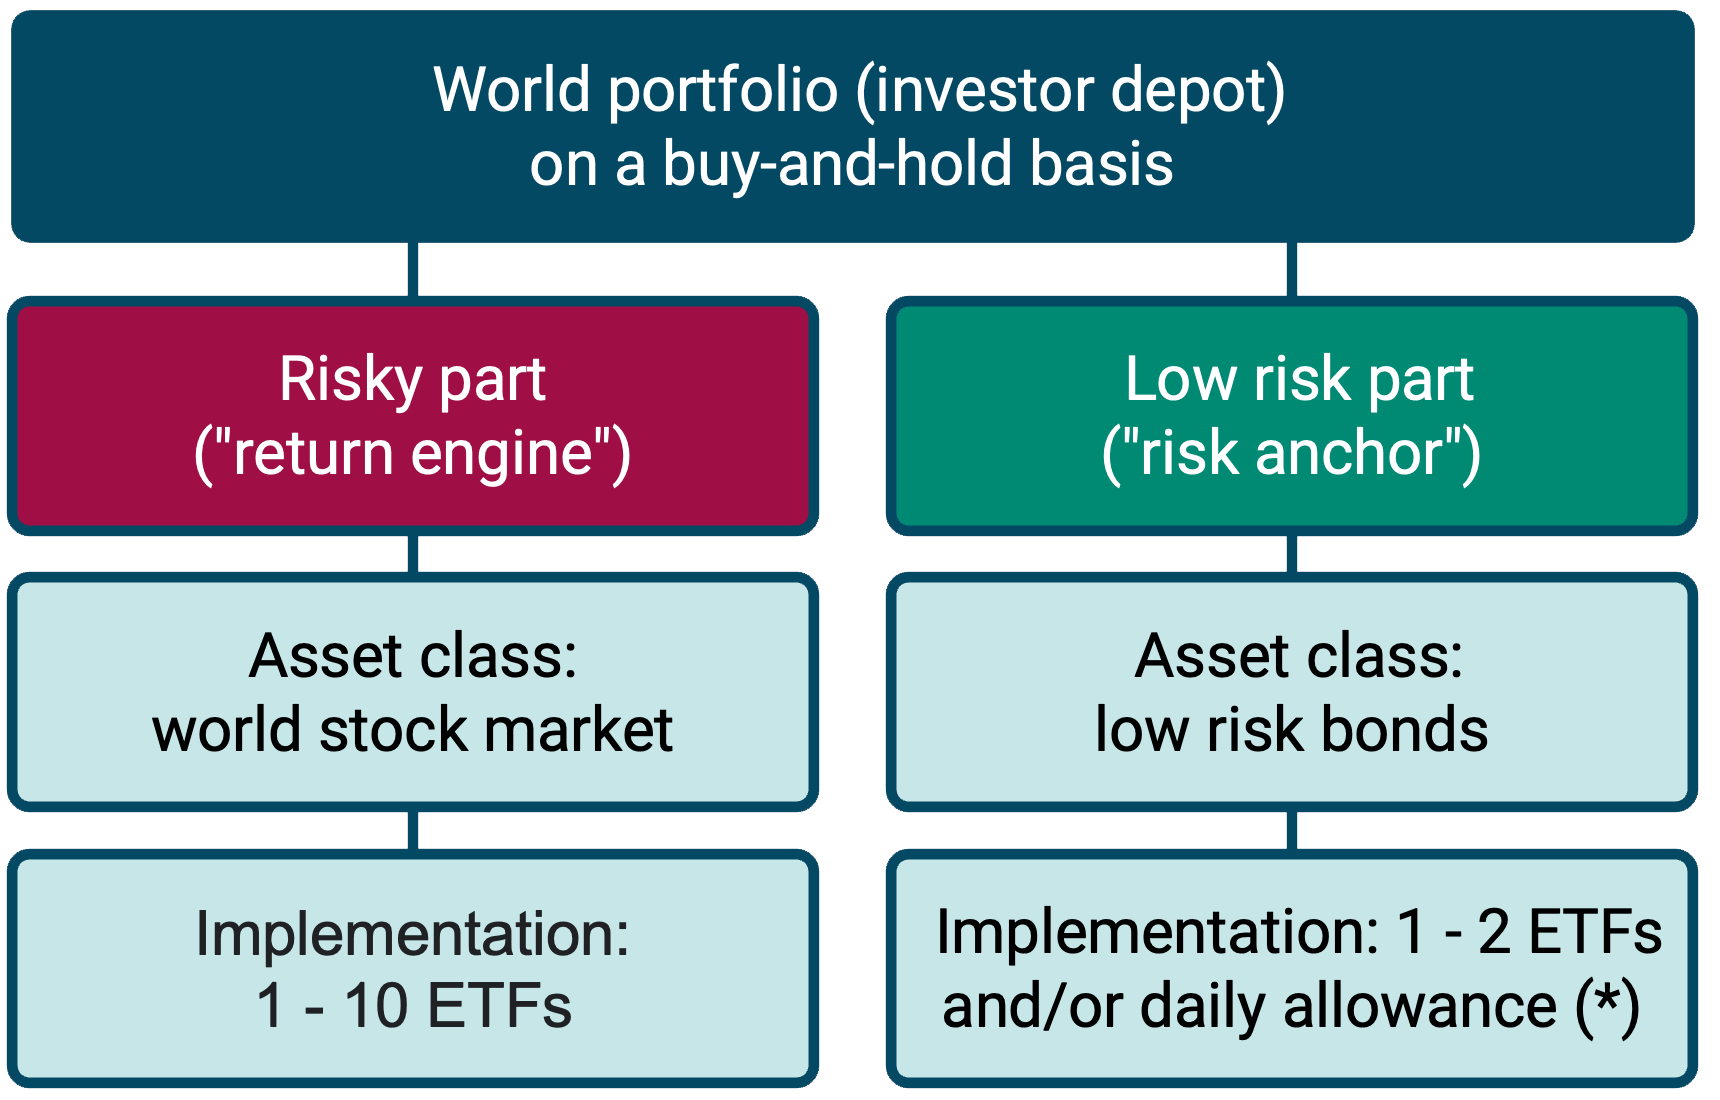
Source: Der Leichte Einstieg in die Welt der ETFs (book in German) by Dr. Gerd Kommer
The risky part of the portfolio acts as a „return engine“ and is responsible for generating the portfolio return, while the risk-free asset serves as a „safety anchor“ (sometimes also referred to as „risk anchor“) and is there to lower the volatility of the overall portfolio.
We call this dichotomy level-1 asset allocation. Basically, all divisions from 100% risky/0% risk-free („100/0 portfolio“) to 0% risky/100% risk-free („0/100 portfolio“) are conceivable, though most investors will choose an allocation somewhere in between and only few favor the extremes.
Where exactly on the risky-risk-free spectrum a given household should be depends primarily on four variables: (i) return expectations, (ii) risk-bearing capacity, (ii) investment horizon and (iv) (low) liquidity requirements. The higher your „score“ on these variables, the riskier (the more „aggressive“) your level-1 asset allocation can be. Conversely, if – overall – the variables are less pronounced, you should start out with a lower-risk („more conservative“) level-1 asset allocation.
In case of significant discrepancies between the individual „risk scores“ of the four characteristics, it is advisable to focus on the most conservative one of them and then make further gradual adjustments as you go along in the subsequent years, after you have gained personal experience with the portfolio.
Once you have settled for a level-1 asset allocation, you need to pick specific ETFs – we call this level-2 asset allocation. In its simplest form, this can be achieved with one ETF for the risky and one for the risk-free portfolio part, respectively. The risky ETF should represent the global stock market as thoroughly as possible, while the „risk-free“ ETF should only contain bonds i) with short duration, ii) high credit rating and iii) is denominated in the investor’s functional currency („home currency“) in order to live up to its risk-reducing function.
A simple example for such a portfolio for an investor living in Germany (with the Euro as their „functional“ currency) could look like this:
- Risky asset: Vanguard FTSE All-World UCITS ETF (ISIN: IE00BK5BQT80) [Status: June 2023] or L&G Gerd Kommer Multifactor Equity UCITS ETF (ISIN: IE0001UQQ933)
- Risk-free asset: Lyxor EuroMTS Highest Rated Macro-Weighted Govt Bond 1-3Y UCITS ETF (ISIN: LU1829219556) [Status: June 2023]
Alternatively, the risk-free part of the portfolio could also be mapped by a savings account with a bank, provided that the investment amount is within the state deposit insurance currently amounting to 100,000 euros per customer and bank in the European Union.
Please note that this is explicitly not an investment recommendation but merely an illustration of how easy it is to implement a passive investment approach.
The world portfolio can be further refined as desired (e. g. by adding so-called factor premia; however, explaining the theory and practice behind factor investing is far beyond the scope of this article).
If you want to invest like Gerd Kommer but don’t want to get your hands dirty, you should take a look at the robo advisor of Gerd Kommer Capital („GKC“) where we do the work for you. As a customer, you get a portfolio that is bespoke to your needs and after answering an initial questionnaire, there is absolutely nothing you have to do as we take care of everything from investing your funds to rebalancing your portfolio and paying the taxes on your capital gains for you. (You need to have tax residency in Germany, the minimum investment amount is currently 5,000 euros [as of June 2023] and there are risks associated with investing.)
Once the portfolio has been set up and the ETFs have been bought, you should at regular intervals make sure that the actual level-1 asset allocation does not deviate too much from its target allocation over longer periods of time. Deviations are normal and happen due to market fluctuations that a portfolio (particularly the risky part) is exposed to every day. The purely mechanical (rules-based) process of bringing a Weltportfolio back close (or at least closer) to its desired level-1 asset allocation is called rebalancing. Rebalancing can be done with new cash going into the portfolio or by withdrawing cash (e. g. for consumption purposes) from the portfolio. It can also be done via selling one ETF and buying more of another. Rebalancing is an important part of passive investing as it ensures that the risk-return character of the portfolio stays within the corridor previously chosen by the investor.
Conclusion
In this article we introduced the main asset classes that you can invest your money in and explored which of them you actually should invest it in. For most private investors, a blend of stocks as a „return engine“ and bonds as a „safety anchor“ should be a suitable solution. We then delved into the debate of active vs. passive investing, highlighting their differences and providing both theoretical and practical arguments to demonstrate why passive investing is superior to its active sibling. Finally, we walked you through a potential implementation of a passive portfolio and pointed out the importance of periodic rebalancing.
Investing in a world portfolio is equivalent to providing capital to the world economy. Thanks to this capital, the more than 10,000 listed companies worldwide can produce goods and services that almost eight billion people on our beautiful planet need every day. Not only does this This ensures their bare survival and helps families to improve their standard of living compared to their parent generation. In return for the provision of such capital in the form of stocks and bonds, the world-portfolio investor is being compensated with a risk-adjusted return.
References
Dimson, Elroy; Marsh, Paul; Staunton, Mike (2019): „Credit Suisse Global Investment Returns Yearbook 2018“; Long Version; Credit Suisse Research Institute; 256 pages
Kommer, Gerd (2018): „Souverän Investieren mit Indexfonds und ETFs. Wie Privatanleger das Spiel gegen die Finanzbranche gewinnen“; Campus Verlag, 5th ed., 2018 (first edition 2002); 415 pages
Kommer, Gerd (2022): „Der leichte Einstieg in die Welt der ETFs: Unkompliziert vorsorgen – ein Starterbuch für Finanzanfänger“; FinanzBuch Verlag, 1st edition, 2022; 180 pages
S&P Dow Jones Indices LLC (2021): „Standard & Poor’s Index Versus Active“; Status: December 2021; Link: https://www.spglobal.com/spdji/en/research-insights/spiva/
Weis, Alexander; Gschossmann, Selina (2022): „Passiv investieren – die Basics“; Blog-Beitrag; September 2022; Link: https://gerd-kommer.de/passiv-investieren-die-basics/