
By Alexander Weis and Selina Gschossmann
This blog post is a brief introduction to passive investing. We would like to take those who would like to get a compact overview of investing with ETFs.
This article assumes a moderate level of stock market knowledge. This means that you should know roughly what a stock, a bond and an ETF are and be familiar with concepts such as return and risk, at least in principle. (If you would like to refresh your knowledge, you can do so by taking a look at our glossary, in which we explain the most important technical terms in the field of investment)
In a first step, we provide an overview of the most important forms of investment, and in a second step we examine their return and risk. We then address the crucial question of investing (“do I want to be an active or passive investor?”) and show why passive investing is the superior alternative to active approaches. Finally, we present a “recipe” for a passive portfolio consisting of just two ETFs – it couldn’t be simpler.
If you are already familiar with the basics of passive investing, we recommend our slightly more advanced blog post “Factor investing – the basics“.
Has passive investing won you over and do you want to implement it easily and conveniently? We have the 1 ETF solution of Gerd Kommer: The L&G Gerd Kommer Multifactor Equity UCITS ETF. Learn more >
Let’s get started!
Asset classes – an overview
To avoid any misunderstandings, here is a classification in advance: In this article, we deal exclusively with liquid assets, i.e. we leave out types of assets such as human capital, company shareholdings or pension insurance claims. There are two reasons for this: Firstly, the asset/liability debate is irrelevant for most illiquid asset types because they can ultimately only be actively managed, and secondly, this is beyond the scope of our brief introduction.
What are asset classes? Asset classes are logical groupings of assets that are relatively similar in terms of return, risk and liquidity.
Here is an overview of the most important asset classes:
- Stock: Equity investments in listed companies
- Bonds: Exchange-traded loans to governments or companies
- Real estate: Residential and commercial real estate
- Commodities Natural resources such as oil, base metals and agricultural commodities
- Precious metals: Subgroup of commodities (such as gold, silver or platinum)
- Collector’s items: Art, luxury cars, luxury watches, fine wines, etc.
- Cryptocurrencies: Bitcoin, Ethereum, Tether, etc.
These are the asset classes in which private investors can invest with acceptable effort and at reasonable cost.
Contrary to popular belief, a bank deposit is not an asset class, but an unsecured loan from the depositor to a credit institution.
Financial products such as capital-forming insurance policies, open-ended real estate funds, private equity, hedge funds, actively managed investment funds and ETFs are also not asset classes in their own right, but merely “packaging” for real asset classes. Such “shells” are not bad per se and differ primarily in their material thickness, with hedge funds (thick and expensive) at one end of the spectrum and ETFs (flimsy and cheap) at the other. For many financial products, in addition to costs and loss of transparency, packaging leads to additional risks that the asset class does not even have within the financial product itself.
Let’s get on with it!
Return and risk – Which asset classes are the best?
In order to find an answer for yourself as to which asset class you should invest in, you first need to be clear about what your actual investment goal is. As a rule, the answer will be: “Achieve the highest possible return with the lowest possible risk”. Therefore, in Table 1 we take a look at the return and risk of our main asset classes (cryptocurrencies are not included in the table due to their too short data history; collector markets are missing due to lack of data availability):
Table: 1: Inflation-adjusted long-term returns of the most important asset classes (in USD) from 1900 to 2021 (122 years)
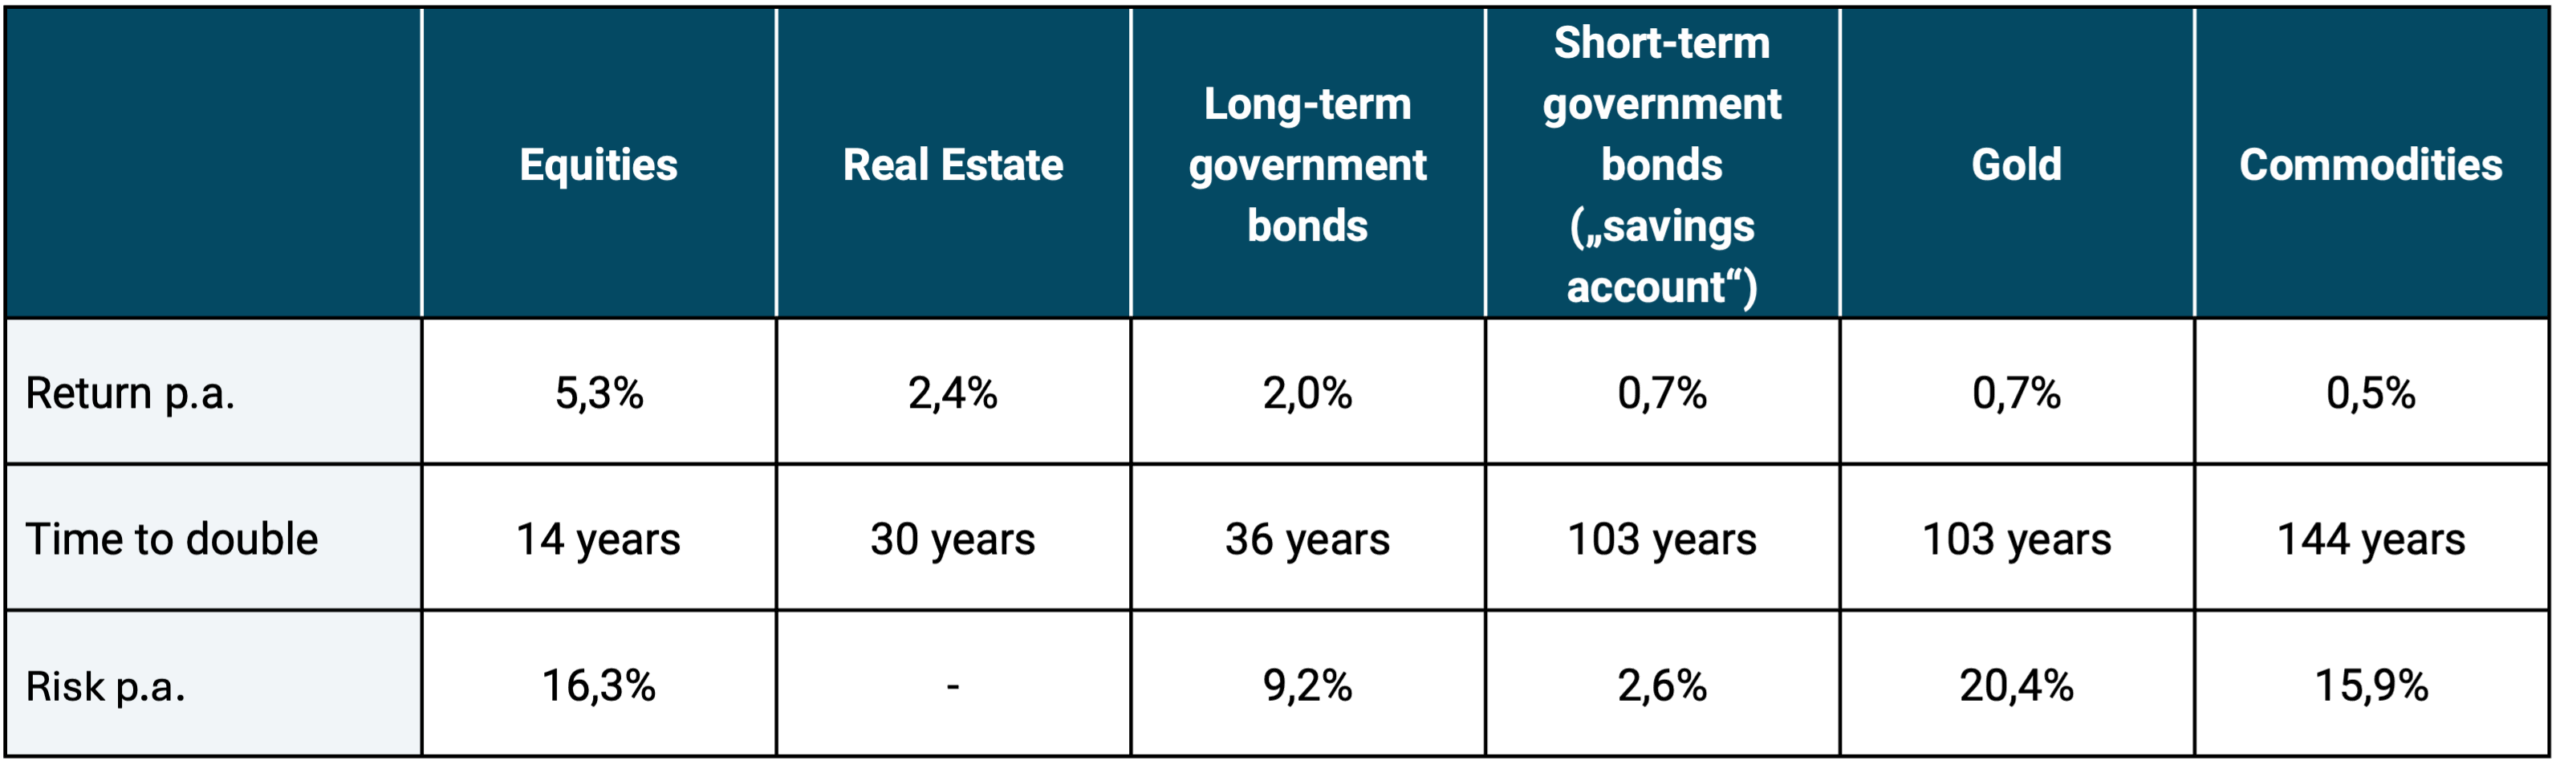
► Data: Dimson, Marsh, Staunton (2022); Morningstar; David S. Jacks (gold, commodities) ► Excluding costs and taxes (maintenance costs for real estate taken into account) ► All returns in US dollars (excluding residential real estate – see below) and total returns (sum of current income + increases in value) and adjusted for inflation ► Residential real estate returns: Deviating period from 1900 to 2017 and population-weighted average of returns from nine Western countries in local currency (reason: lack of data availability) excluding return-reducing transaction costs for buying and selling ► “Duration until doubling”: number of years until an initial one-off investment would have doubled at the given average return (excluding costs and taxes) ► “Risk”: standard deviation of calendar year returns (volatility) from 1975 to 2021. No value is given for real estate because real, “honest” data that is fairly comparable with the other asset classes is not available.
What can be read from the table? First of all, it is noticeable that the figures are probably much lower than most of us would assume. One reason for this is that these are real returns, i.e. returns after deducting inflation. Another reason is that the media, the Internet and advice books in general have trained us to have an exaggerated idea of realistically achievable returns. The bare figures in the table are what the capital markets have produced over the last 120 years, without illusionary fantasy performance. For better or worse, we will have to accept this reality – whether we like it or not, but more on that below.
Secondly, it is clear that stocks have by far the highest returns of all asset classes: Twice as high as that of real estate, two and a half times as high as that of long-term government bonds and six times as high as that of gold and savings accounts. 👊🏻
Thirdly, it shows that short-term government bonds are the asset class with the lowest risk of all asset classes – again by a wide margin.
What do we learn from this? If you want to get the most return from your money, there is no way around stocks. However, as most investors cannot or do not want to live with the strong fluctuations of stocks, an equity investment should be supplemented by a less volatile addition. Due to their low volatility, short-term high-quality bonds or an interest-bearing bank deposit (provided the amount is within the state deposit guarantee) are best suited for this purpose.
So much for the preliminaries – now it’s time to get down to business!
Active vs. passive investing – the crucial question
Anyone who wants to invest their money on the stock market in securities such as stocks or bonds will sooner or later be confronted with the question of whether an active or passive investment approach makes more sense. But what is active and passive investing all about? (In order to keep things as simple as possible, we will focus exclusively on stocks and leave the bond market out of the equation)
Put simply, a passive investor simply buys the “market” (in our case, the stock market). At the end of the day, the investor receives the market return (minus the costs of investing) and is therefore fully exposed to market fluctuations. (“Buying the market” is achieved by purchasing one or more ETFs) As we have seen above, a good 5% return per year can be achieved in the stock market after deduction of inflation but before deduction of taxes and costs.
An active investor, on the other hand, is not satisfied with the market return and believes that it is possible to systematically beat the market. You can try to do this by either buying the stocks that you think will outperform the market (“stock picking”) or by always “getting into” the market when it is at the bottom and “getting out” just before the next expected crash (“market timing”). Active investing is inevitably always a form of stock picking, market timing or a mixture of both. You can invest actively as a Do-it-yourself investor (“DIY”) or by using an advisor (such as a bank or asset manager).
If you believe in active investing and don’t want to be a DIY investor, you can outsource this to a fund manager, an asset manager or a bank for relatively high open and hidden (difficult to recognize) fees.
For all those who may have lost track of all the metaphors in the meantime, we have conjured up Table 2, which explains the differences between active and passive investing in a somewhat drier and more concise form:
Table 2: The biggest differences between active and passive investing
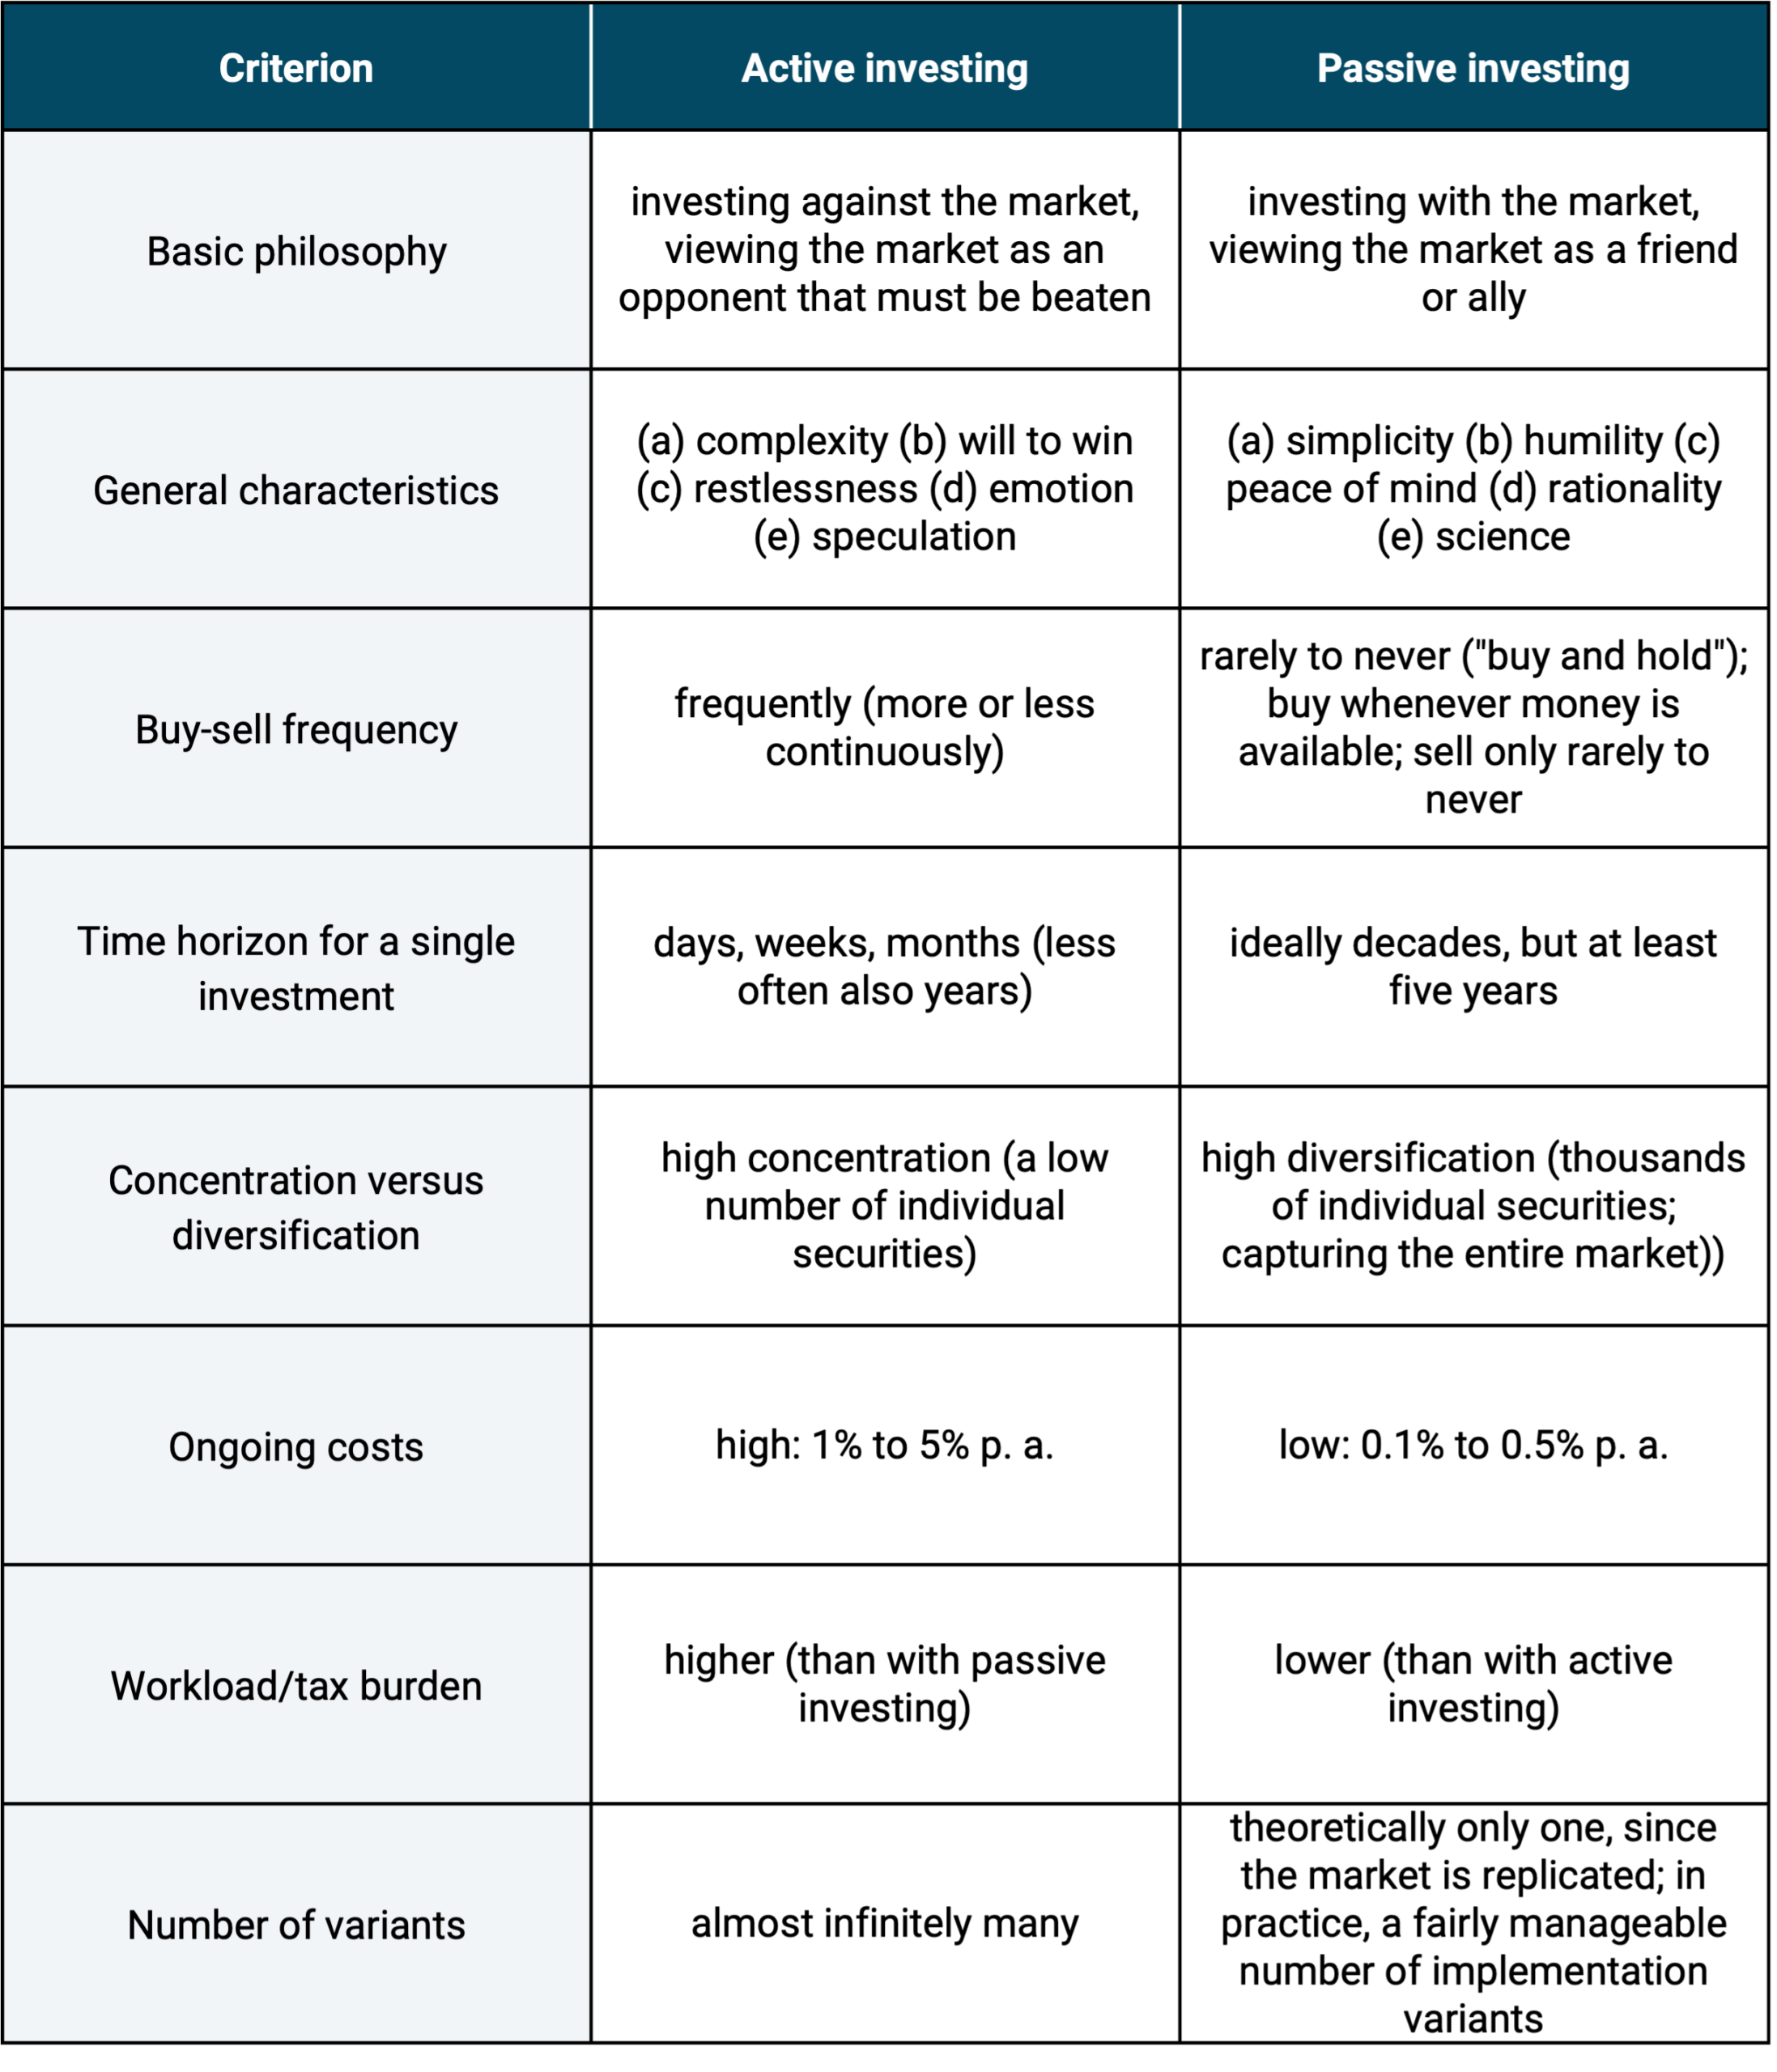
►Source: Der leichte Einstieg in die Welt der ETFs by Gerd Kommer
So why invest passively?
The short answer is: Because it is more profitable.
This statement does not come from us, but from science. Over the past 60 years or so, literally thousands of studies have been published proving the statistical superiority of passive investing.
However, as there is significantly more money to be made with active investing from a financial services provider’s perspective than with passive investing, the established financial sector – science or no science – offers almost exclusively active investing.
Active investing is also more profitable for the traditional media and the Internet because stories about active investing and speculation can achieve a higher circulation or click-through rate – not to mention the advertising revenue generated by the providers of actively managed financial products.
In any case, the scientific evidence that passive investing is superior to active investing is literally overwhelming. However, in order to avoid leaving it at speculation, we refer to one theoretical and one empirical argument from science in our line of argument and then let the figures speak for themselves.
Theory: The arithmetic of active investing
The arithmetic of active investing states that all investors must collectively generate the market return because, by definition, together they form the market. This in turn means that 50% of all money invested must generate a return below the market return and the other 50% a return above the market return. It is important to emphasize that this is a mathematical necessity that cannot be argued away. No further assumptions about costs, taxes and the composition or behavior of market participants are necessary.
Back to the argument: This means that – before costs (!) – 50% of all active investors must outperform the market and, conversely, 50% must underperform the market. If we also assume that active investing incurs higher costs than passive investing – see “Ongoing costs” in Table 2 – the proportion of active investors who beat the market must be between 0% and 50%. This means that the purely statistical probability of outperforming the market is strictly below 50% and is therefore lower than the probability of winning a coin toss. To find out how high this proportion is in practical reality, let’s build a bridge and take a look at our empirical argument.
Empiricism: Outperformers are as reliable as a zero at roulette
The practical part of our argument is based on a study by S&P Dow Jones Indices, one of the world’s larger index providers, which bears the somewhat cumbersome title “Standard & Poor’s Index Versus Active“, or “SPIVA” for short. The study compares the performance of actively managed funds with a fair passive benchmark, which allows conclusions to be drawn about the success of active investing over different time periods and geographical regions. (There are a number of comparable studies that come to similar conclusions, but we chose the SPIVA study because it is one of the most thorough of its kind, has been updated every six months for 20 years and is publicly available free of charge)
Two main conclusions can be drawn from the SPIVA study:
- Outperformers are in the minority: The proportion of actively managed funds that outperformed their passive benchmark was around 40% on average across all regions (industrialized and developing countries) in the last three years from 2019 to 2021 and only around 10% over the last 20 years from 2002 to 2021 (the extent and number of underperformers increases with the length of the period under review). The obvious question is why not simply invest in this minority, which brings us to the second conclusion.
- Outperformers rarely remain outperformers: The composition of funds that manage to beat their benchmark changes more or less randomly from period to period. Of the top 25% of equity funds surveyed in 2017, only 62% managed to make it back into the top 25% in the following year 2018; in 2019 it was 37%; in 2020 only 28% and in 2021 a barely recognizable 1.7% with a magnifying glass. (In the case of bond funds, the share fell to 0% in the third subsequent year 2020). The popular method of investing only in funds that have performed particularly well historically is therefore doomed to failure.
We will simply leave these – in our view – powerful findings as they are and thus conclude our argument against active and in favor of passive investing. If you are not yet fully convinced of the advantages of passive investing and/or would like to read more arguments against active and in favor of passive investing, we recommend our blog post “Ten reasons why active investing works badly“.
If we have already won you over, then we are delighted and as a thank you we have brought a very special treat for you at the end: A simple recipe for a tasty and juicy passive portfolio consisting of just two ETFs.
How does passive investing work?
Passive investing has been easy in principle since the invention of index funds in the early 1970s and ETFs as a variant of index funds in the early 1990s. Basically, you only have to do two things:
Firstly, determine the percentage allocation of his portfolio between the risky and low-risk portfolio parts (e.g. 60/40) and secondly, fill the two portfolio parts with specific ETFs.
This static asset allocation is implemented on a strict buy and hold basis. Buy and hold is just as much a part of passive investing as broad global diversification through the use of index funds and ETFs.
This is Dr. Gerd Kommer’s world portfolio concept derived from science. In the simplest case, one ETF product is sufficient for the risky part of the portfolio and one for the low-risk part. We have illustrated this in the following graphic.
Graphic: Schematic representation of the global portfolio
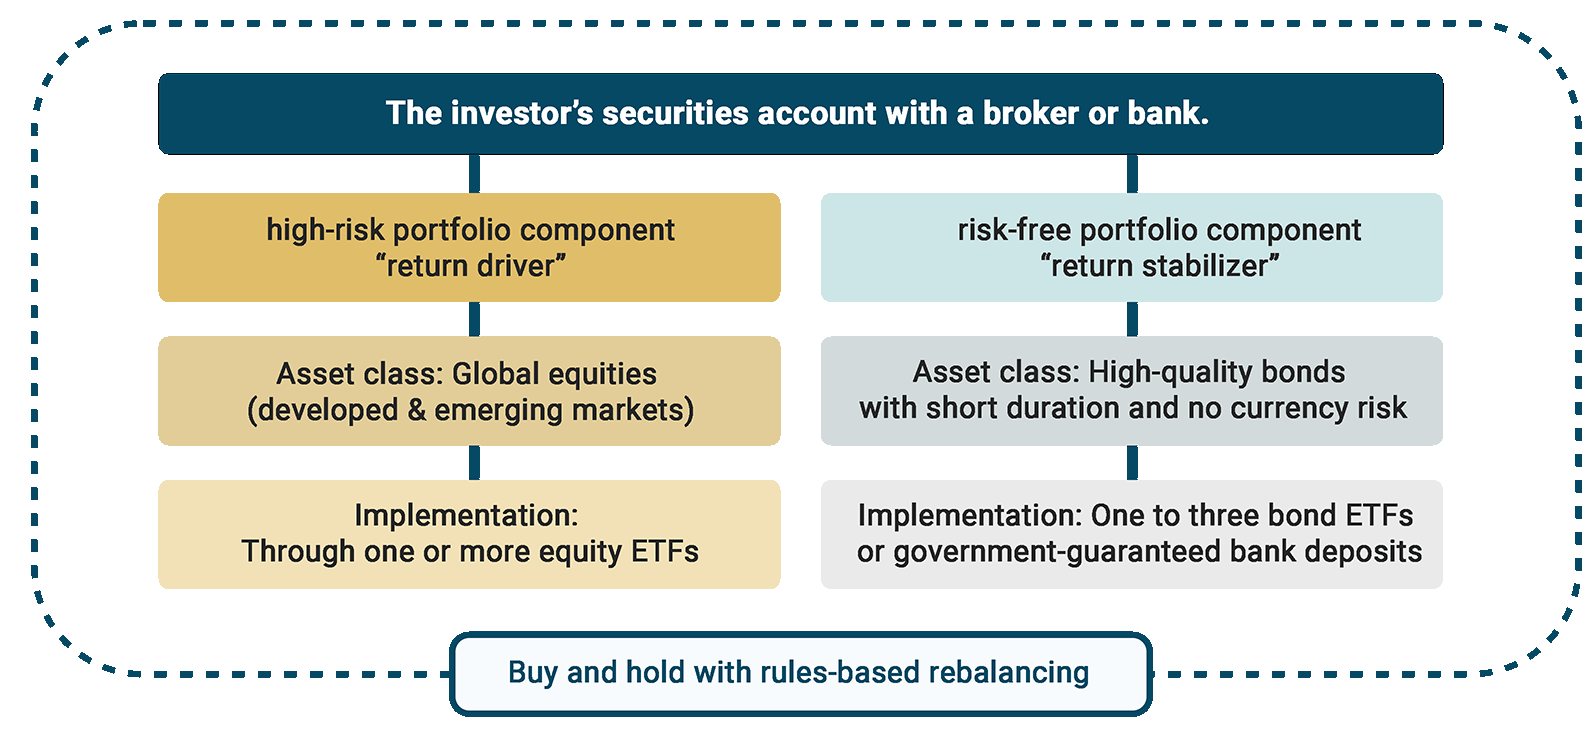
►Source: Der leichte Einstieg in die Welt der ETFs by Gerd Kommer. ► (*) Overnight money only if the amount is covered by the state deposit guarantee of a country with a credit rating of at least AA.
The risky portfolio component (“RBT”) is responsible for generating the portfolio return as a “return driver”, while the low-risk (“risk-free”) portfolio component (“RFT”) serves as a “safety anchor”. We call this dichotomy the Level 1 asset allocation. Basically, all allocations from 100% RBT/0% RFT (“100/0 portfolio”) to 0% RBT/100% RFT (“0/100 portfolio”) are conceivable, but the music usually plays somewhere in between, as few investors will prefer the fringe allocations.
Where specifically a given investor household is located on the RBT-RFT spectrum depends primarily on four variables: Expected return, risk-bearing capacity, liquidity requirements and investment horizon. The more pronounced these variables are (with the exception of liquidity requirements), the more risky (“aggressive”) the allocation of a portfolio can be. Conversely, if the variables are less pronounced, you should start with a lower-risk (“more conservative”) level 1 asset allocation.
If the variables differ in terms of their characteristics, it is advisable to use the most conservative of them as a guide, at least initially, and then make further gradual adjustments in the years that follow as personal experience is gained with the portfolio.
Once you have decided on a level 1 allocation, you have to decide on specific ETFs – we call this the level 2 asset allocation. In its simplest form, this can already be implemented with one ETF each for the RBT and RFT. The RBT ETF should track the global stock market as closely as possible, while the RFT ETF should only contain bonds i) with a short residual maturity, ii) with a high credit rating and iii) in the investor’s home currency in order to fulfill its risk-reducing function.
In its simplest form, such a portfolio could look like this:
- Risky portfolio component (“RBT”): Vanguard FTSE All-World UCITS ETF (ISIN: IE00BK5BQT80) [as at: September 2022] or L&G Gerd Kommer Multifactor Equity UCITS ETF (WKN: WELT0A)
- Low risk portion of the portfolio (“RFT”): Lyxor EuroMTS Highest Rated Macro-Weighted Govt Bond 1-3Y (DR) UCITS ETF (ISIN: LU1829219556) [Status: September 2022]
Alternatively, the low-risk part of the portfolio could also be mapped via an overnight or fixed-term deposit account at a bank, provided the investment amount is within the state deposit guarantee of EUR 100,000 per customer-bank combination.
Please note that this is explicitly not an investment recommendation, but merely an illustration of how easy it is to implement a passive investment approach. The world portfolio can be further refined as desired (e.g. by adding so-called factor premiums; however, explaining the theory and practice behind factor investing is beyond the scope of this article).
Once the portfolio has been defined and the ETFs have been purchased, you should ensure at regular intervals that the current level 1 asset allocation does not deviate too much from the desired target allocation, even over longer periods of time. This is due to the market fluctuations to which a portfolio (especially the RBT) is exposed every day. The manual return to the target allocation is called rebalancing and we have already published a detailed blog post on this subject entitled “Rebalancing: advantages, methods, principles”.
Conclusion
In this article, we have looked at what asset classes there are and which of them you should definitely have in your portfolio. For the vast majority of private investors, a mix of stocks as a “return driver” and bonds as a “safety anchor” in the portfolio is likely to be suitable. We then looked at the active-passive investing debate and discussed the differences between active and passive investing, before using theoretical and practical arguments to demonstrate why passive investing is the superior alternative to active investing. Last but not least, we discussed the practical implementation of a passive portfolio (often referred to as Dr. Gerd Kommer’s world portfolio concept) and also highlighted the importance of the rebalancing principle.
Investing in a world portfolio means making capital available to the global economy. This capital enables over 10,000 listed companies worldwide to produce goods and services that almost eight billion people on our beautiful planet Earth need every day to ensure their basic survival and improve their standard of living compared to their parents’ generation. For the provision of risk capital in the form of stocks and bonds, the world portfolio investor is compensated with a risk-adjusted return.
Literature
Dimson, Elroy; Marsh, Paul; Staunton, Mike (2019): “Credit Suisse Global Investment Returns Yearbook 2018”; Long Version; Credit Suisse Research Institute; 256 pages
Gerd Kommer, Gerd (2018): “Souverän Investieren mit Indexfonds und ETFs. Wie Privatanleger das Spiel gegen die Finanzbranche gewinnen”; Campus Verlag, 5th edition, 2018 (first edition 2002); 415 pages
Gerd Kommer, Gerd (2022): “Der leichte Einstieg in die Welt der ETFs”; FinanzBuch Verlag, 1st edition, 2022; 180 pages
Gerd Kommer, Gerd; Weis, Alexander (2019): “Factor investing – the basics”; blog post; May 2019; link: https://gerd-kommer.de/blog/factor-investing-die-basics/
Gerd Kommer, Gerd; Weis, Alexander (2020): “Ten reasons why active investing works badly”; blog post; February 2020; link: https://gerd-kommer.de/en/blog/ten-reasons-why-active-investing-works-badly/
S&P Dow Jones Indices LLC (2021): “Standard & Poor’s Index Versus Active”; as at December 2021; link: https://www.spglobal.com/spdji/en/research-insights/spiva/