
By Gerd Kommer and Alexander Weis
Note: The data basis in this blog post was expanded in November 2021 to include the years 2019 and 2020.
“Passive investing” – i.e. very broad diversification with market-neutral index funds on a buy-and-hold basis – is probably one of the world’s greatest success stories in capital market investment over the past 50 years. But no matter how impressive an innovation is, there will always be someone who, even in the face of its great success, will ask further questions and probe even deeper. This has also been the case with “passive investing” with market-neutral index funds over the past twenty years or so. (The term “market neutral” is used differently in the specialist literature than in this blog post, where it generally refers to long-short strategies that aim to eliminate overall market risk). The research findings of several hundred financial economists in recent decades have led to a variant of the passive investing approach, namely “factor investing”, often also referred to as “Smart-Beta investing”.
What are “factors” or “factor premiums”? Factor premiums are statistically identifiable drivers of return and risk in an asset class such as stocks, bonds or real estate. They explain a large part of the risk-return profile within the asset class. Statistically, the return and risk of a securities portfolio can only be explained by more than 90% if the “factor exposure” in this portfolio is identified and measured – i.e. how strongly a portfolio is exposed to these factor premiums. A comparison: The number of hours students spend studying for a math exam statistically explains a significant portion of the deviation of students’ grades from the class average. In this example, “number of hours” is the factor. Other factors, such as a student’s IQ, explain further parts of the statistical deviation from the average.
In this first part of our blog trilogy on factor investing in the stock asset class, we first look at the basics. In the second part, which will be published next month, we describe the smartest way to introduce factor premiums into your portfolio and what you need to bear in mind.
The best-known factor premium for stocks is the “small-size premium”, often just called the “size premium” or “small-cap premium”. It states, quite simply, that small listed companies (small in terms of market capitalization) produce higher stock returns on average than large companies or the total market (see table below for the period 1975 to 2020).
Through purely mechanical, disciplined overweighting of factor premiums in a portfolio, it is possible to generate an additional return after costs and taxes compared to the total market; hence the term “premium”. In terms of small caps, “overweighting” would mean increasing their percentage share in the portfolio above the share that small caps have in a market-neutral “total market portfolio” (small caps account for around 15% of the total market capitalization of the world stock market). “Overweighting” sounds more complicated than it is, because this kind of overweighting can be achieved quite simply by buying a small-cap ETF.
Exposure to the small cap premium is therefore not for those who have small caps in their portfolio to a “normal extent”, but only for those who have small caps in their portfolio to a greater extent than is already the case in the underlying asset class universe.
Factor investing is essentially passive investing, i.e. the renunciation of active “stock picking” (targeted selection of individual stocks; more generally, “asset picking”) or active “market timing” (tactical “in-out” in relation to entire market segments).
Factor investing differs from traditional passive investing in one important respect. With factor investing, the individual securities in the portfolio are not weighted purely according to their market capitalization, but this weighting principle is softened, e.g. by overweighting small cap stocks.
The best-known and, in our opinion, best-established premiums in the scientific literature are listed below:
- Small size: Small caps tend to have higher returns than large caps.
- Value: Companies with favorable valuations (“value stocks”) – measured by key figures such as the price/earnings ratio – tend to have higher returns than highly valued companies (“growth stocks”).
- Quality and/or profitability: High “quality” companies – as measured by profitability ratios such as the profit-to-book ratio or debt ratios – tend to have higher returns than low quality companies.
- Momentum: Companies that have recently had relatively high returns tend to have higher returns for a limited time and vice versa.
- Political Risk: Stocks that are exposed to high political risk (primarily emerging market stocks) tend to have higher returns than stocks for which this is less the case.
- Low investment or asset growth: Stocks with relatively low total balance sheet growth tend to have higher returns for a limited time than those with high total balance sheet growth.
The following table shows the historical excess return of factor indices over the respective market-neutral benchmark. This version of quantifying factor premiums is particularly conservative and is known as “long-only factor premiums”. We explain what this is all about below.
Table: Overview of the magnitudes of several factor premiums per year (p.a.) from 1975 to 2020 (46 years) and subperiods in these 46 years for the global market (“long-only premiums”)
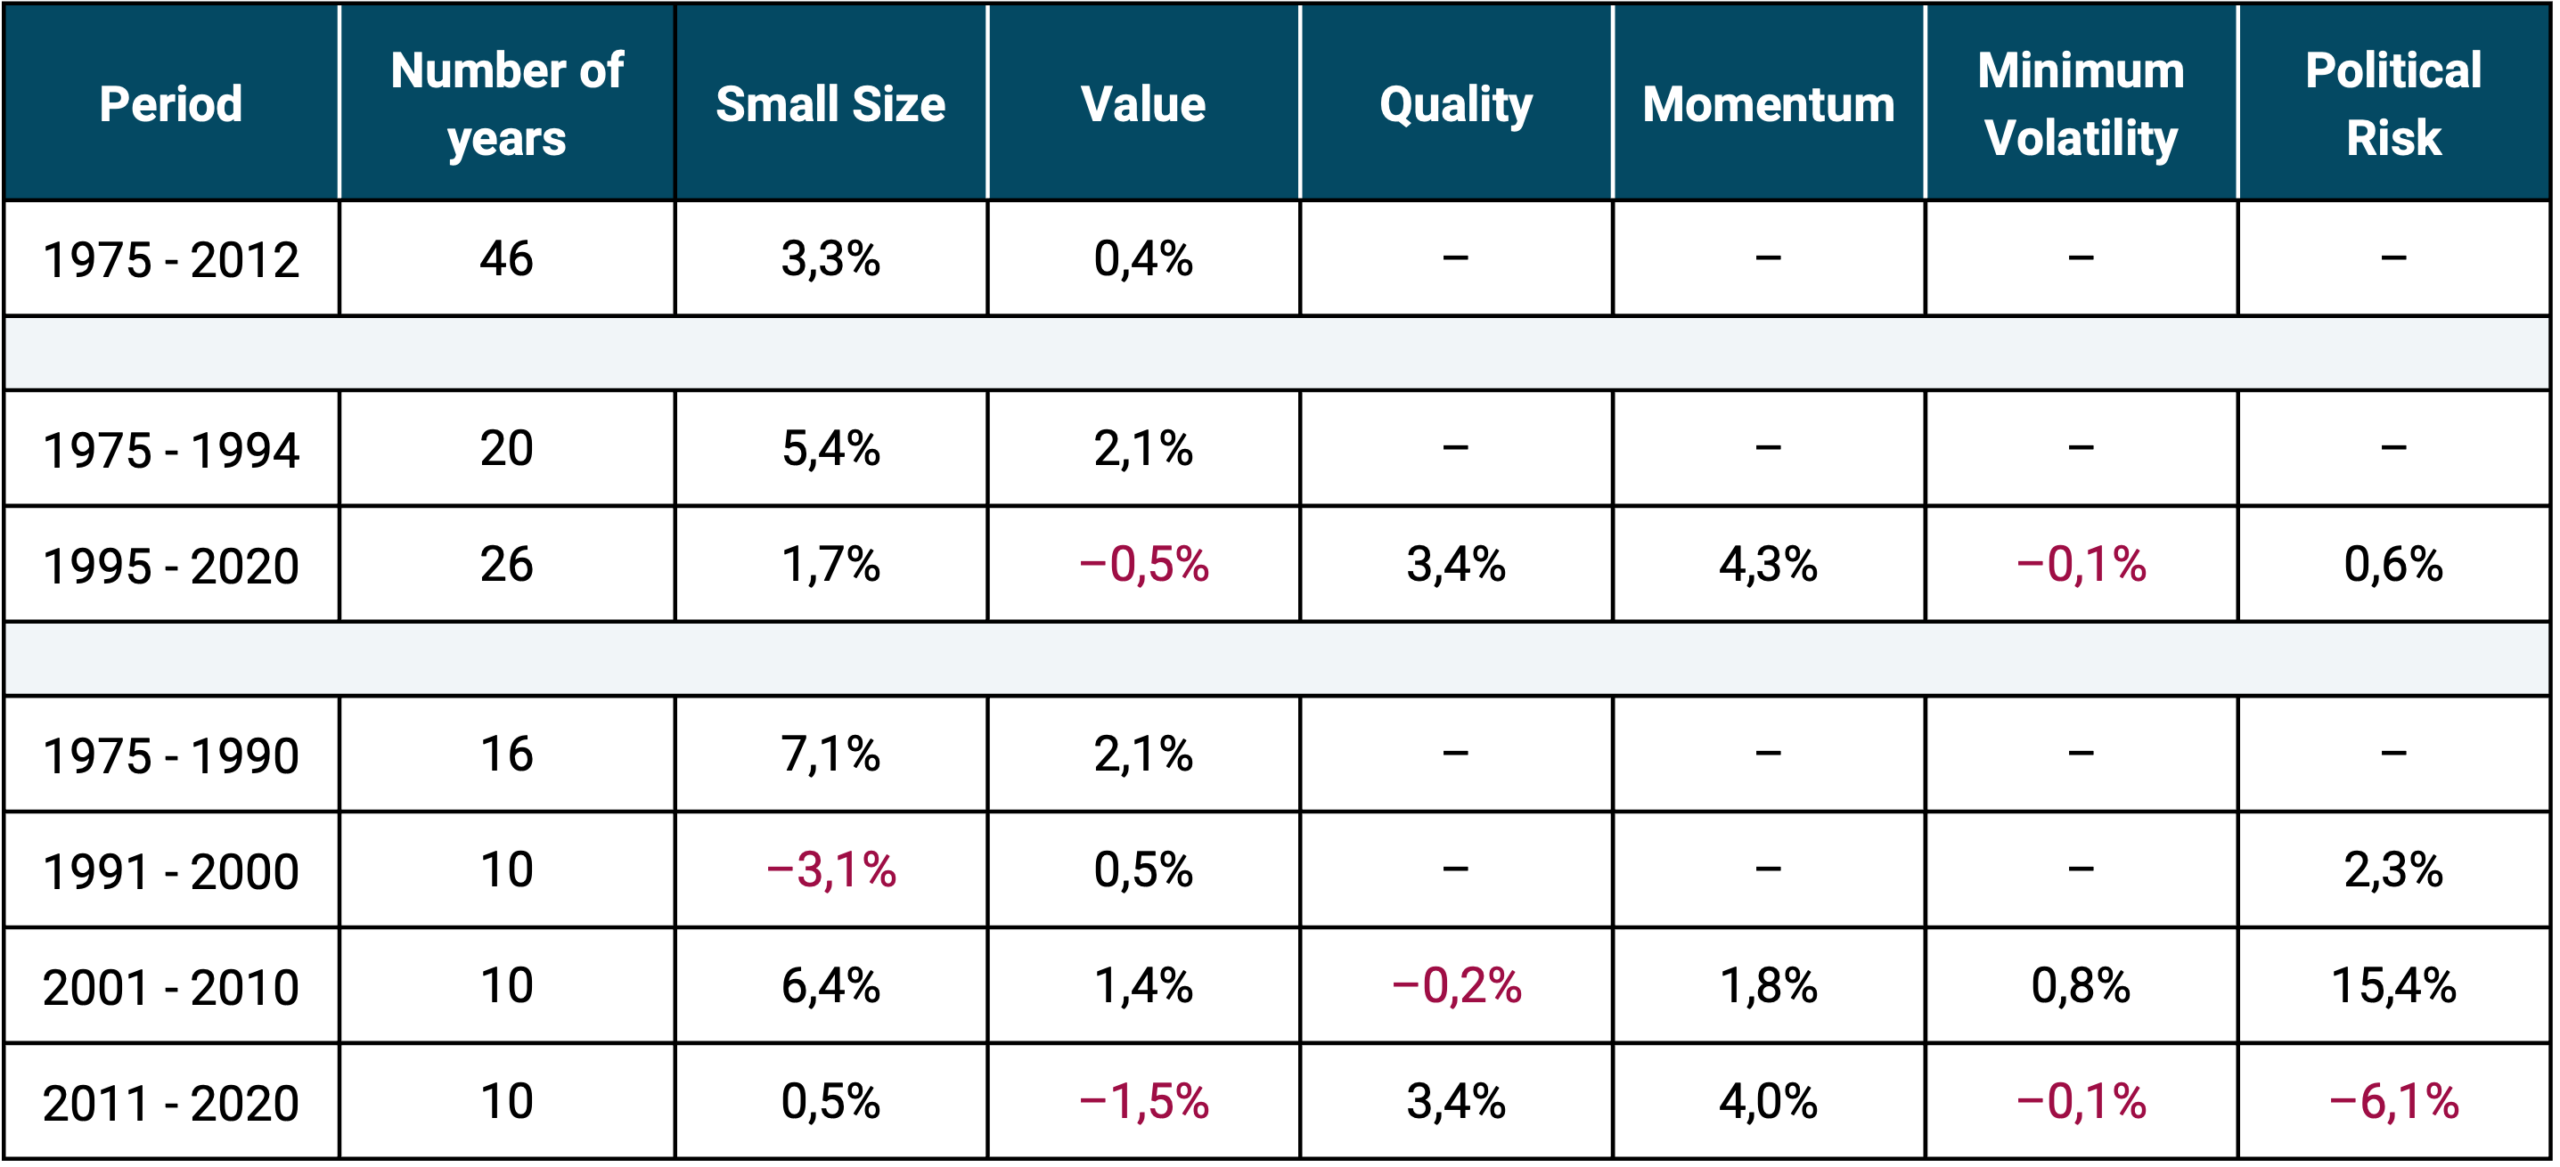
Source: MSCI, Dimensional Fund Advisors, Deutsche Bundesbank. The longest available data series are shown in each case (longer data series exist for individual countries). ► The factor premiums are “long-only factor premiums” (see explanations below) based on arithmetic averages. ► All data before costs and taxes. ► Historical returns offer no guarantee that they will be repeated on a similar scale in the future. ► Scientific studies on historical factor premiums arrive at slightly different results depending on the country or region, time period and specific research methodology.
The attentive reader will immediately notice that many factor premiums were not positive in every single period. It is therefore quite possible, even probable and necessary, that a given factor premium will be negative over several years or decades, as factor premiums are statistically expected premiums. Expected in this context means that a positive premium can be expected over a sufficiently long period of time, but that it will fluctuate strongly in the short and medium term. If the premium did not fluctuate unpredictably in the short and medium term, it would have long since “arbitraged away”, i.e. disappeared, because with high consistency everyone would only buy these stocks. The premiums must therefore be unreliable in the short and medium term.
The following figure illustrates this fluctuation potential graphically. The chart shows the annual realizations of the five factor premiums mentioned above in the period from 1995 to 2020. The vertical axis corresponds to the percentage of premiums in a given year, while the horizontal axis represents the passage of time.
Illustration: Annual development of long-only factor premiums from 1995 to 2020
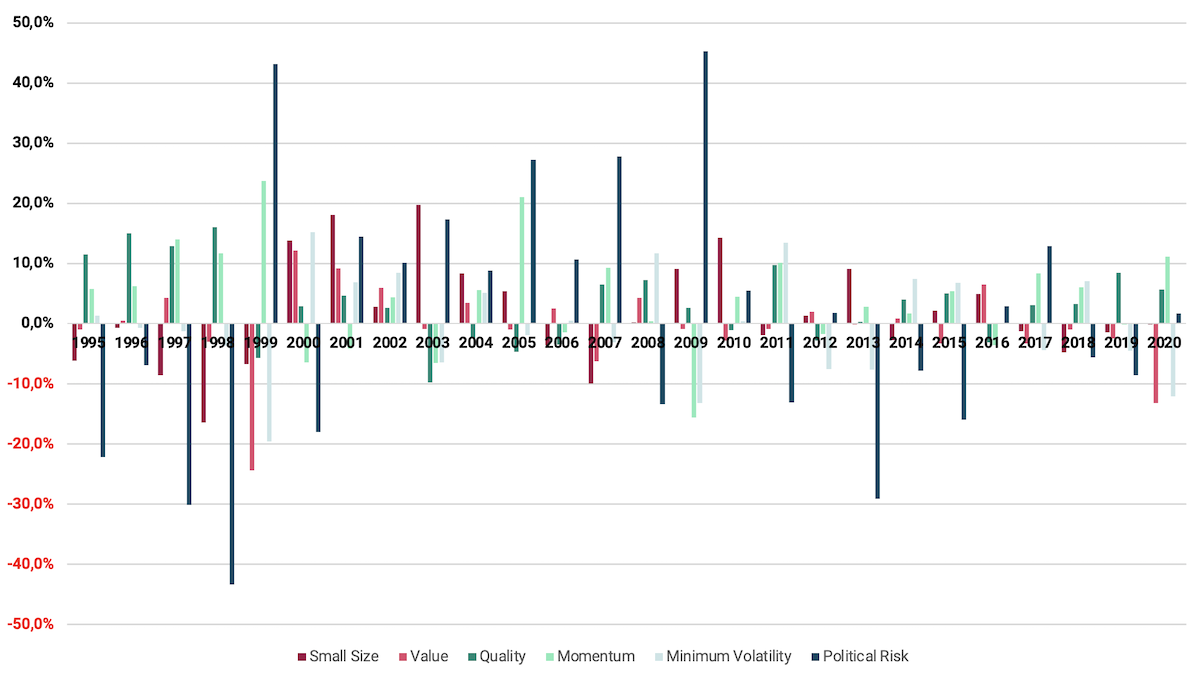
Source: Own calculations based on raw data from Dimensional Fund Advisors and MSCI.
A closer look at the bars shows once again that individual factor premiums can underperform their benchmark over a period of years (negative bars). The same also applies to the so-called equity premium, i.e. the excess return of the stock market over the “risk-free” money market (the “savings book return”). The equity premium can also be zero or negative over ten years or more. This is shown by data from the last 120 years for a large number of countries, including Germany and the USA. In order to mitigate the “unreliability” of factor premiums, it is therefore advisable to diversify across several premiums, i.e. not to put all your eggs in one basket.
One more word on the “long-only” concept mentioned above: Factor premiums can be calculated either as long-only or long-short premiums. With long-short factor premiums, stocks with a high level of the desired characteristic (such as small size) are overweighted and stocks with a high level of the opposite characteristic (in this case large size) are sold short [1]. Long-only factor premiums refer only to the “long side” (buy side) of factor premiums; no short selling is assumed. Long-short factor premiums are correspondingly higher than long-only premiums. As UCITS funds (“retail funds”) – and therefore all ETFs distributed in Germany – are not normally allowed to engage in short selling, we focus on long-only factor premiums.
If you want to understand factor premiums, the following facts, among others, are important:
- Different factor premiums are not “additive”. As different factor premiums influence each other, the return of several factor premiums cannot simply be added together. These interactions not only vary from premium to premium, but can be both positive and negative. This means that different factor premiums can reinforce or weaken each other. Since two given premiums usually have a correlation [2] of less than one, risk-reducing diversification benefits can be realized by including several factor premiums in the portfolio, which can therefore not be seen as a disadvantage, but rather welcomed as a desirable side effect of “harvesting” several factor premiums. But more on this in the second part of our factor investing series.
- Another implication of the volatility of factor premiums is that you should maintain your chosen course even if the selected premiums are negative over a longer period of time. It can be anticipated that these will turn positive again at some point. In the long-term average, they are positive in all cases by definition (and also in the historical data).
- Exploiting factor premiums costs money compared to market-neutral investing. However, the additional costs are more than offset by the gross premiums (premiums before costs).
- Factor premiums do not disprove the well-known Efficient Market Hypothesis (EMH for short), at least in its basic form, as is repeatedly claimed in the media or on the internet. The “father of the EMH”, Eugene Fama, is also probably the most deserving researcher when it comes to factor premiums. The EMH merely says that you can’t systematically beat the “market” (asset class return) after costs and risk with publicly available information. This thesis is very well supported by empirical data from the past 50 years and is compatible with the existence of factor premiums.
- Is factor investing still “passive investing”? In our view, this question is pointless and too “ideological” for us. Real “passive” investing does not exist anyway. Even the most passive investor must constantly make decisions and is therefore “active” to a certain extent. It is obvious to us that the global stock market is not a completely homogeneous stew, but consists of a few “risk-return sub-segments” that are statistically identifiable. Factors define and describe these sub-segments. In general, factor investing is of course more “active” than market-neutral passive investing.
How will factor premiums develop in the future and can we assume that historical empirical values – correctly understood – can also be transferred to the future? Of course, this question cannot be answered with 100% certainty – as is almost always the case in social science disciplines. In principle, this also applies to the level of “normal” returns for all asset classes without factor premiums: Stocks, interest-bearing investments, real estate, precious metals, commodities or art. Nowhere can the level of expected absolute or relative returns over the next 20 years or beyond be predicted with absolute certainty. Factor premiums are no exception here.
If all factor premiums that have been added to the portfolio were to fall to zero in the future, the investor’s loss (the so-called “opportunity costs”) would only consist of the currently approximately 0.3 percentage points higher product costs of “Smart-Beta funds” compared to market-neutral index funds. Assuming the disappearance of one or two of the factor premiums in the future, this would mean a reduction in the excess return, but not an underperformance of the factor portfolio. Overall, the expected outperformance through the use of factor premiums more than makes up for their additional costs.
To summarize: Factor premiums are able to explain the risk-return ratio of an equity portfolio to a high degree, and to a higher extent than other objective characteristics such as sector affiliation, dividend yield or subjective characteristics such as the quality of management or the relationship of a company to certain macroeconomic developments (interest rates, inflation, economic growth, etc.).
By overweighting the main factor premiums in a certain way, we believe that an expected excess return of one to one and a half percentage points per year after costs can be achieved compared to the total market in the long term (historically, this outperformance was noticeably higher – see the table in this article). In our view, the best-covered premiums are small size, value, quality, momentum and political risk. Individual factor premiums do not “work” reliably in every given year and have a correlation of less than +1, which is why it makes sense to diversify across several premiums.
In the second part of this series on factor investing, we look at the best way to incorporate multiple factor premiums into your portfolio. In it, we will discuss the various options for implementing multifactor investing.
Has factor investing won you over and do want a simple and convenient implementation? We have the 1 ETF solution of Gerd Kommer: The L&G Gerd Kommer Multifactor Equity UCITS ETF. Learn more >
Endnotes
[1] Short selling: The sale of a security (or asset in general) that the short seller does not yet own at the time of sale T0, but has borrowed from a third party for a fee. If the loan period ends a few weeks or months later at time T1, the short seller must return the security to the lender. To do this, the short seller must now buy it on the open market. The short seller hopes that the market price of the security will be lower in T1 than in T0. Then he would make a profit. He is therefore speculating on falling prices.
[2] Correlation is a measure of the interaction between two random variables and can assume values between -1 and +1. A correlation of -1 or +1 means a perfectly negative or positive correlation, while a correlation of 0 means that there is no or only a random interaction. An example of positive correlation is the number of calories a person consumes and their body weight: A higher number of calories tends to lead to a higher body weight.
References
Baltussen, Guido; Swinkels, Laurens; Van Vliet, Pim (2019): “Global Factor Premiums”; available at SSRN: https://ssrn.com/abstract=3325720
Berkin, Andrew; Larry Swedroe (2016): “Your Complete Guide to Factor-Based Investing. The Way Smart Money Invests Today”; BAM Alliance Press; 358 pages.
Gerd Kommer, Gerd (2018): Investing confidently with index funds and ETFs. How to win the game against the banks”; 5th edition; Campus 2018. 410 pages.
Momentum effect: Dolvin, Steven; Foltice, Bryan (2016): ” Where Has the Trend Gone? An Update on Momentum Returns in the U.S. Stock Market”; Internet source: https://papers.ssrn.com/sol3/papers.cfm?abstract_id=2813333.
Political-Risk-Effekt: Pàstor, Luboš; Veronesi, Pietro (2013): “Political Uncertainty and Risk Premia”; In: Journal of Financial Economics; Volume 110; Issue 3
Profitability-/Quality-Effekt: Asness, Clifford et al. (2013): “Quality Minus Junk”; Internet source: https://www.aqr.com/library/working-papers/quality-minus-junk
Small-size effect: Shi, Wenyun; Xu Yexiao (2015): “Size Still Matters!”; Internet source: http://www.efmaefm.org/0EFMAMEETINGS/EFMA%20ANNUAL%20MEETINGS/2015-Amsterdam/papers/EFMA2015_0198_fullpaper.pdf
Value effect: Zhang, Lu (2005): “The Value Premium”; In: The Journal of Finance; Vol. 60; Issue 1